Simulation Result
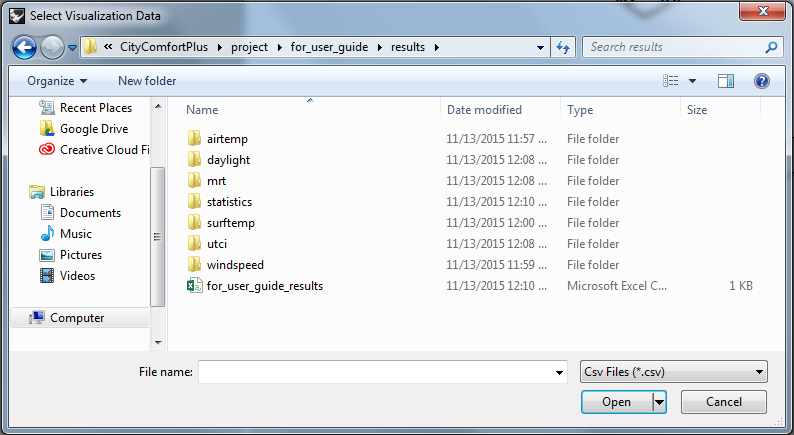
All simulation results are stored in the folder of the following path C:/CityComfortPlus/project/yourprojectname/results/. Contents in each folder are explained below

[airtemp] you can find the results for localized air temperature in Degree Celsius. A matrix written in .csv format is presented for each hour. The naming of each csv file follows the rule below: month_day_hour_min.csv
[daylight] this folder stores values of direct and indirect solar radiation, both values measured on an upward facing horizontal plane at each sensor location with the unit W/m2. The former is the direct component of sunlight (d_month_day_hour_min.csv); the latter consists of diffuse sunlight from the atmosphere and reflected light from walls and bulidings (i_month_day_hour_min.csv)
[mrt] this is the results for mean radiant temperature (MRT) defined as the uniform temperature of an imaginary enclosure in which the radiant heat transfer from the human body is equal to the radiant heat transfer in the actual non-uniform enclosure[3] MRT has a strong influence on the energy balance of human bodies[4]
[surftemp] this folder records modeled surface temperature for four groups of surfaces: the sun-lit walls, sun-lit ground, shaded walls, and shaded ground at each time-step.
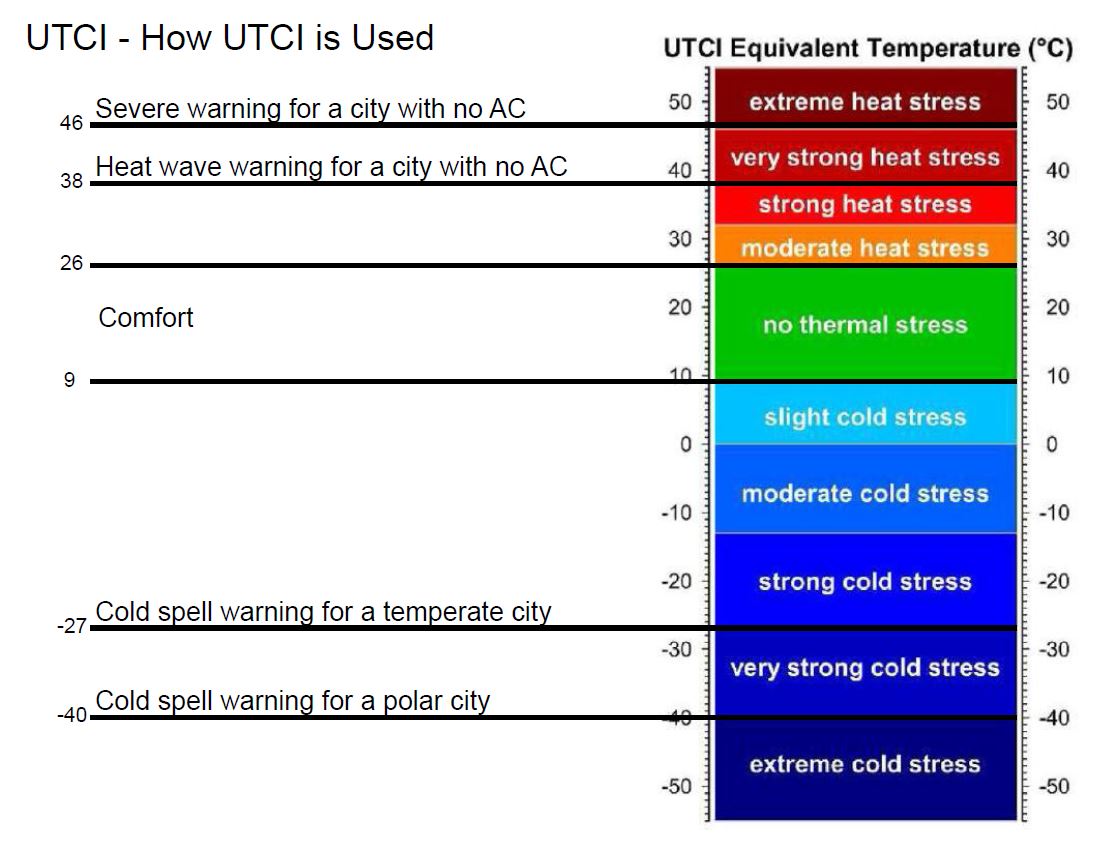
[utci] this folder stores the equivalent temperature (°C) measured in Universal Thermal Climate Index(UTCI). UTCI is defined as a reference environment with 50% relative humidity (but not exceeding 20 hPa), with still air and radiant temperature equaling air temperature, to which all other climatic conditions are compared. The UTCI equivalent temperature for a given combination of wind, radiation, humidity and air temperature is then defined as the air temperature of the reference environment which produces the same strain index value [8] The UTCI equivalent temperature is directly linked to thermal comfort and thermal stress. The assessment Scale is provided below [9]:

[statistics] you will find the statistics results of accumulative thermal comfort/stress if you have performed statistical analysis before. Results in the ‘statistics’ folder include the following items: accumulative comfort, accumulative discomfort, accumulative cold stress hours (CSH), and accumulative heat stress hours (HSH).
- Accumulative comfort is the percentage of comfortable hours during the designated time period. It is a value between 0 and 1. The higher the numerical value is, the more likely that the sensor grid position is comfortable. 0 means the assessment location is consistently uncomfortable (UTCI outside of 18-26 °C), while 1 meaning consistently comfortable (UTCI within 18-26 °C).
- Accumulative discomfort is the percentage of uncomfortable hours during the designated time period. It is a value between 0 and 1 and it is the opposite of Accumulative comfort above.
- Accumulative cold stress hours (CSH) is the integration of cold stress (measured in ASHRAE standard 7-point scale [5]) over the assessment time period. Cold stress is a response of the body to cold temperatures resulting from heat loss from a portion of the body, such as the feet, hands, limbs or head.[6] CSH is a measure of the severity and duration of cold stress.
- Accumulative heat stress hours (HSH) is the integration of heat stress (measured in ASHRAE standard 7-point scale [5]) over the assessment time period. Heat stress occurs when human body is cooling itself via regulatory mechanism such as vaso-motor or sweating [7] HSH is a measure of the severity and duration of heat stress.
